How do you even begin to visualize $277 trillion? If we convert it into seconds, 277 trillion is the equivalent of 8.8 million years.
It’s been estimated that Jeff Bezos increases his net worth by about $321 million a day. At that rate, you’d have to work for close to 863,000 days, or 2,364 years, to reach $277 trillion.
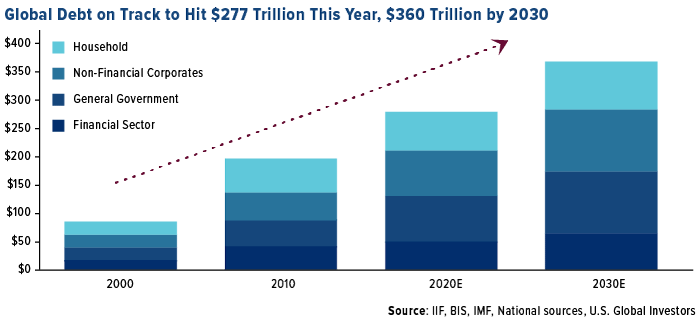
It’s also the total amount of debt the world is expected to hit by year-end. That’s according to the Institute of International Finance (IIF), whose members include some 400 banks and financial firms around the globe.
As of the end of September 2020, the world added $15 trillion to the debt pile, with government borrowing accounting for half of the increase, the IIF says. Debt in developed markets is set to hit 432% of gross domestic product (GDP). For emerging markets, it’s closer to 250%.
By 2030, the IIF estimates, we could be looking at $360 trillion in total debt.

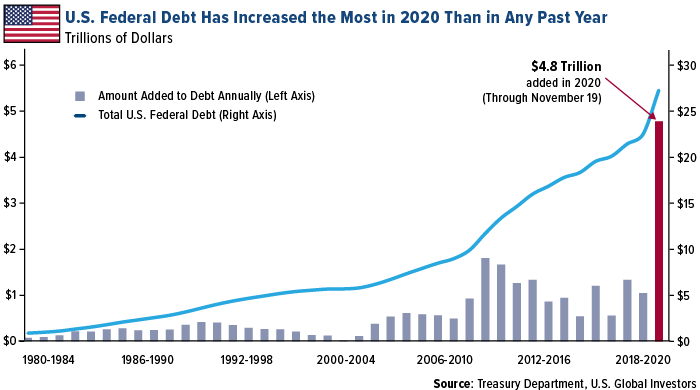
As you may expect, the economic fallout from the pandemic has dealt a huge blow to government coffers. So far in 2020, the U.S. has added more than $4.8 trillion to the federal debt, the most ever for a single year.
This has brought total federal debt up to a record $27 trillion, or 143% of U.S. GDP. Debt per U.S. taxpayer now comes in at a staggering $218,450.

We can’t blame everything on the pandemic. According to the IIF, the past four years have seen the largest debt buildup on record, with $52 trillion accumulated since 2016.
What this means is that, even during the pre-pandemic economic boom years, governments were not practicing sound fiscal management. Granted, governments weren’t the only contributors to the debt buildup, but they represent a huge part of it.
Knowing this, there’s no way we can reasonably expect them to get us out of this mess.
Jared Dillian: Gold Is A Hedge Against Bad Government Decisions
Bloomberg published an article by Jared Dillian, investment strategist at Mauldin Economics. In the article, titled “Gold Is a Hedge Against Bad Government Decisions,” Dillian argues that investors mistakenly believe that gold is a hedge against inflation and stock market crashes.
Since the year 2000, U.S.-denominated gold has surged roughly 555% versus 146% for the S&P 500 Index. The reason for this, according to Dillian, is that “significantly looser financial conditions” have meant that there are “no constraints on monetary and fiscal policy.”
Indeed, the world is stuck in a low-rate environment. As of right now, no 10-year government bond in any major economy in Europe or North America yields more than 1%. Several countries—including France, Germany, Sweden, the Netherlands and Switzerland—issue debt with a negative yield. And that’s the nominal yield, before factoring in inflation.
Currency devaluation is real, and it’s only likely to accelerate. If you’re seeking to protect your family’s wealth against the failures of governments and central banks, we don’t believe there’s a more prudent option than hard assets – including gold.
Gold Starting to Look Like a Buy
The yellow metal is starting to look oversold, especially after the November 27 selloff on hopes of a vaccine and broad economic recovery.
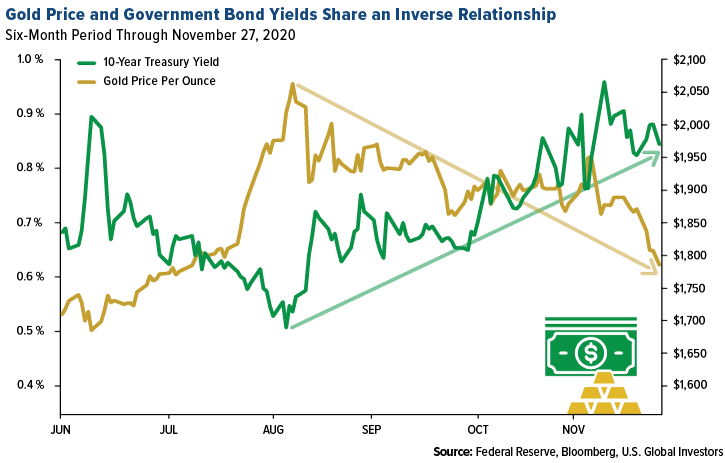
The yellow metal has also been under pressure from rising bond yields. The yield on the 10-year Treasury has been on the upswing, and this can have a huge impact on the direction of gold prices. Take a look below. Gold hit its all-time high of nearly $2,070 an ounce on August 6, when the 10-year yield traded as low as 0.5%. Remember, this is the nominal yield. Adjusted for inflation, it’s below zero.

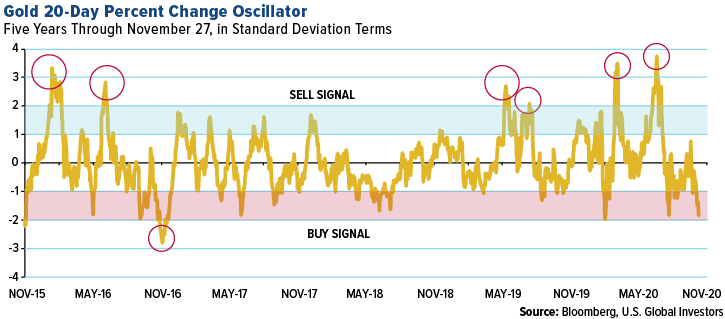
We believe gold is a buy at these prices. Looking at the 20-day percent change oscillator chart, gold was trading down close to 2 standard deviations from its five-year mean, meaning its well within the “buy” range.

Want regular updates on gold news? Follow us on Twitter – @USGlobalETFs – by clicking here.
Standard deviation is a measure of the dispersion of a set of data from its mean. The more spread apart the data, the higher the deviation. Standard deviation is also known as historical volatility. The S&P 500 Stock Index is a widely recognized capitalization-weighted index of 500 common stock prices in U.S. companies.
