If you were considering taking the family on a European vacation, now may be a good time, as the U.S. dollar and euro just achieved parity for the first time in 20 years.
Prices have skyrocketed everywhere, not just in the U.S. A five-star hotel in France or Italy that might have cost $350 a night before the pandemic can now cost as much as $1,600.
Much is being made about the USD/EUR exchange rate, but the truth is that “King Dollar” has made large gains on a number of world currencies this year as the U.S. has embarked on an aggressive monetary tightening cycle to control inflation. Below you can see how much G-10 currencies have fallen in 2022 compared to the greenback.
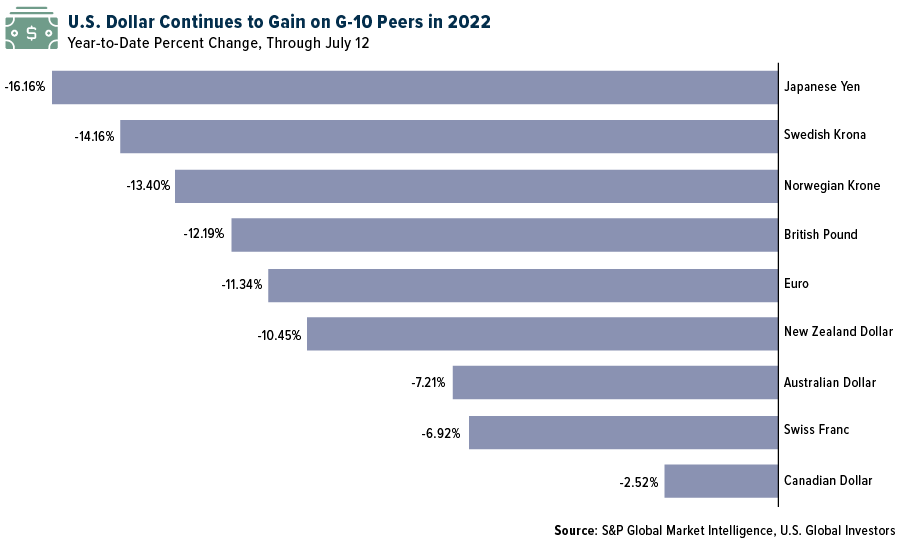
A stronger dollar is favorable not only for Americans traveling abroad but also companies that pay to import goods from other countries—think big-box retailers such as Walmart, Target, Home Depot and Dollar Tree.
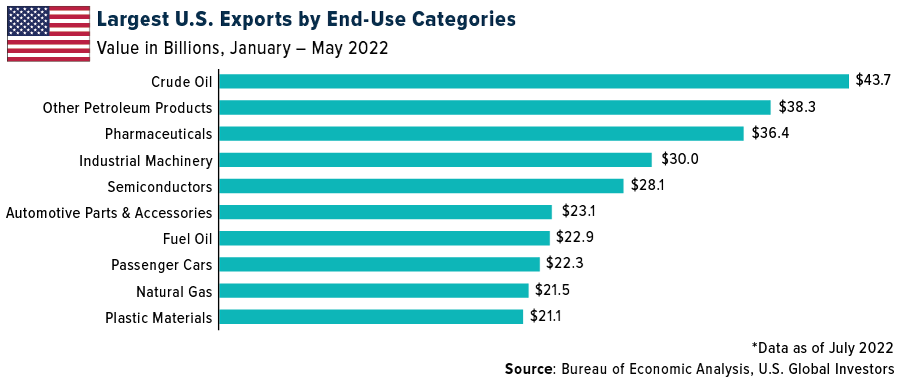
On the other hand, a soaring dollar can hurt U.S. exporters since it makes goods more expensive to foreign buyers, dampening demand. Between January and May of this year, the top U.S. exports by end-use included crude oil and petroleum products, mostly due to the massive increase in crude prices.
Other top exports included pharmaceuticals, industrial machinery, semiconductors, automotive parts and accessories, fuel oil, automobiles, natural gas and plastic materials, according to Bureau of Economic Analysis (BEA) data.
“King Dollar” Pushes Gold Deep Into Oversold Territory
Among the biggest targets of the dollar’s strength is gold, which, like most commodities, is priced in the greenback internationally. The yellow metal has historically been valued as a safe haven asset, particularly during times of economic uncertainty and high inflation, which we’re certainly facing today.
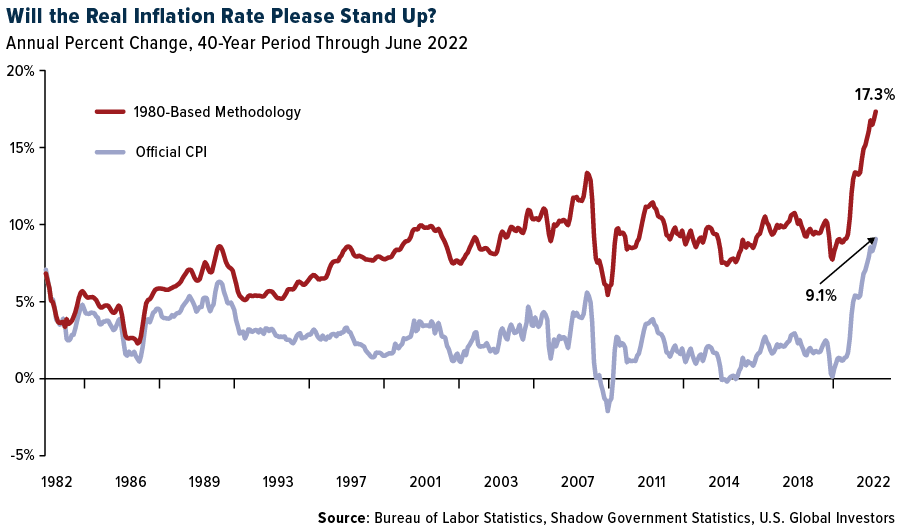
June’s consumer price index (CPI) came in at a scorching annual rate of 9.1%, the highest in over 40 years, but if we use the inflation methodology from 1980, the figure is closer to 17% or more, as seen in the chart below.
Despite this, gold has steadily fallen since its 2022 high of $2,070 per ounce, set in early March. As of July 19, gold is off close to 7% for the year, and last week it briefly traded below $1,700 for the first time since March 2021.
In addition, gold has signaled a “death cross,” which occurs when the 50-day moving average of a commodity dips below its 200-day moving average.
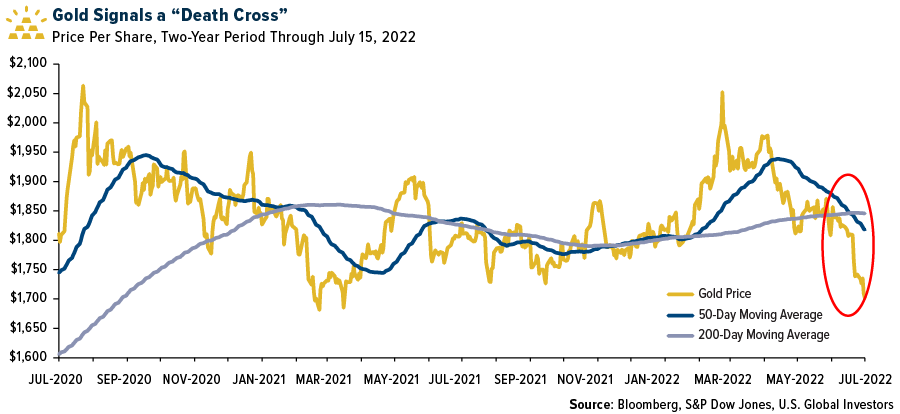
Some investors and traders see this move as a bearish sign. We see it as a potential buying opportunity for investors. If you believe that the dollar is overextended relative to other currencies, and that a reversal could happen in the coming weeks and months, now may be a good time to consider accumulating gold, especially if you think we’re in the midst of a recession.
Deepest Yield Inversion Since 2000
Some industry analysts believe we very well be in a recession already, based on the Atlanta Federal Reserve’s GDPNow real-time forecast. The latest forecast, as of last Friday, is that the U.S. economy contracted 1.5% in the second quarter, following an annual decrease of 1.6% in the first quarter.
Even if that ends up not being the case, the bond market seems to be telling us that a pullback may be imminent.
A yield inversion occurs when the shorter-term Treasury bond trades with a higher yield than the longer-term Treasury. Remember, bond yields go up when prices go down, so when yields invert, it suggests that investors find shorter government notes riskier to hold than longer-dated ones.
Historically speaking, inversions have been astonishingly accurate at predicting recessions. Going back at least 40 years, every recession has been preceded by an inverted yield curve, using the two-year and 10-year Treasuries.
Not only is the yield curve inverted right now, but it’s inverted at the biggest point since the year 2000, soon before the dotcom bubble burst.
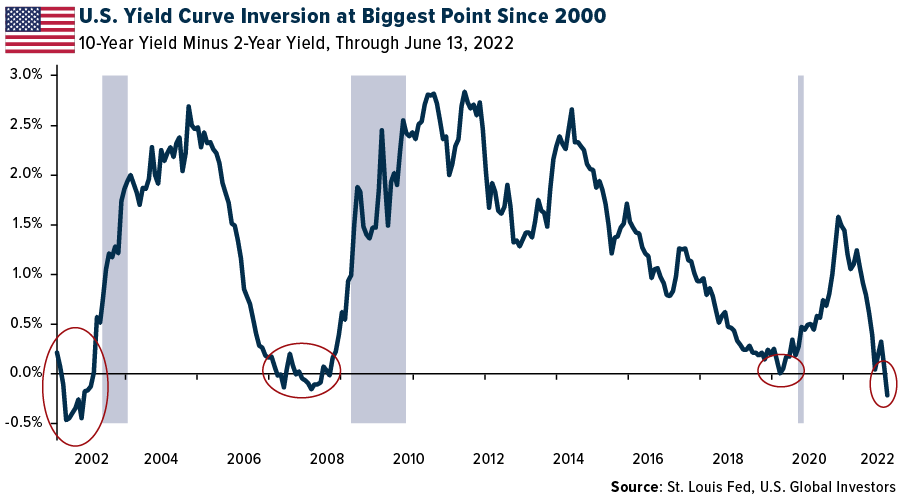
So, what does this mean? Past performance is no guarantee of future results, but we could be looking at a pullback, if not this year, then perhaps the next.
Do with that information as you wish, but we believe it could be wise and prudent to have exposure to gold at this time.
Looking for one way to gain exposure to gold through mining and royalty names? Explore the GOAU ETF by clicking here!
All opinions expressed and data provided are subject to change without notice. Some of these opinions may not be appropriate to every investor.
Please carefully consider a fund’s investment objectives, risks, charges, and expenses. For this and other important information, obtain a statutory and summary prospectus for GOAU here. Read it carefully before investing.
Investing involves risk, including the possible loss of principal. Shares of any ETF are bought and sold at market price (not NAV), may trade at a discount or premium to NAV and are not individually redeemed from the funds. Brokerage commissions will reduce returns.
Because the funds concentrate their investments in specific industries, the funds may be subject to greater risks and fluctuations than a portfolio representing a broader range of industries. The funds are non-diversified, meaning they may concentrate more of their assets in a smaller number of issuers than diversified funds.
The funds invest in foreign securities which involve greater volatility and political, economic and currency risks and differences in accounting methods. These risks are greater for investments in emerging markets. The funds may invest in the securities of smaller-capitalization companies, which may be more volatile than funds that invest in larger, more established companies.
The performance of the funds may diverge from that of the index. Because the funds may employ a representative sampling strategy and may also invest in securities that are not included in the index, the funds may experience tracking error to a greater extent than funds that seek to replicate an index.
The funds are not actively managed and may be affected by a general decline in market segments related to the index. Gold, precious metals, and precious minerals funds may be susceptible to adverse economic, political, or regulatory developments due to concentrating in a single theme. The prices of gold, precious metals, and precious minerals are subject to substantial price fluctuations over short periods of time and may be affected by unpredicted international monetary and political policies. We suggest investing no more than 5% to 10% of your portfolio in these sectors.
Fund holdings and allocations are subject to change at any time. Click to view fund holdings for GOAU.
Distributed by Quasar Distributors, LLC. U.S. Global Investors is the investment adviser to GOAU.
The S&P 500 is a stock market index tracking the stock performance of 500 large companies listed on exchanges in the United States.
The Consumer Price Index (CPI) measures the overall change in consumer prices based on a representative basket of goods and services over time.
The Atlanta Fed GDPNow real-time forecast is a running estimate of real growth domestic product growth based on available data (at a seasonally adjusted annual rate).
Holdings may change daily. Holdings are reported as of the most recent quarter-end. The following securities mentioned in the article were held by one or more accounts managed by U.S. Global Investors as of (06/30/22): The Boeing Co.
