Fall isn’t in the air yet here in South Central Texas, but the season is often associated with something else: stronger performance in airline stocks.
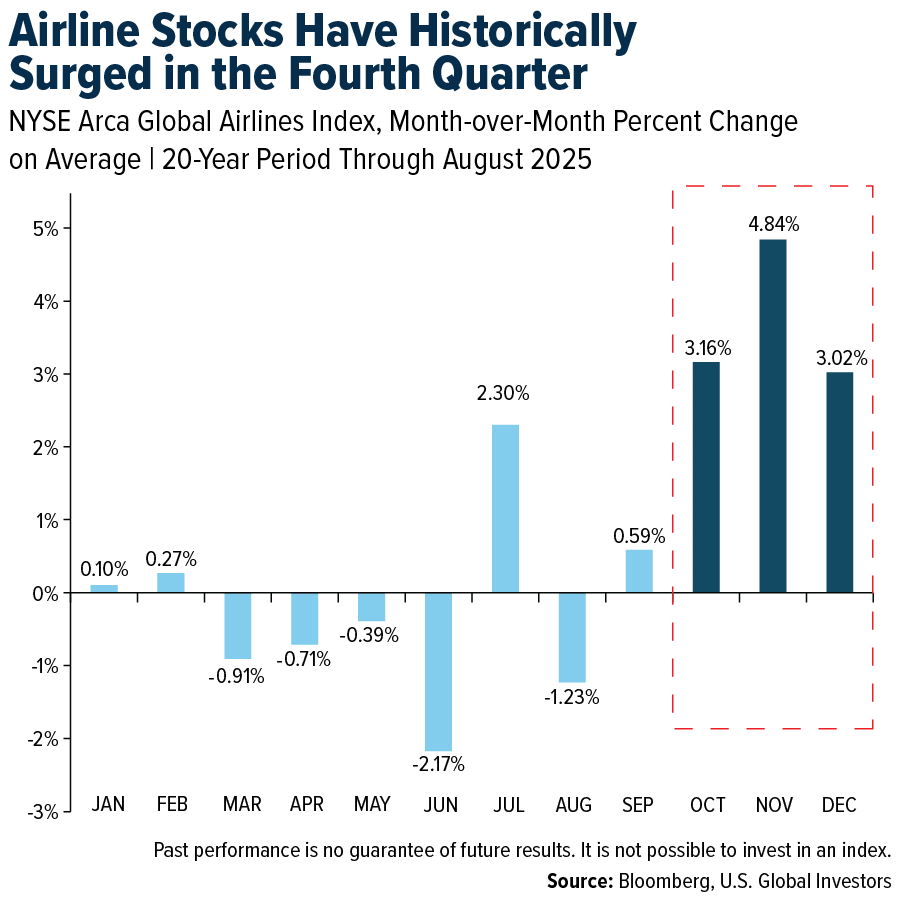
Looking back over the past 20 years, airline equities have tended to outperform in the final three months of the year, with the NYSE Arca Global Airlines Index gaining over 3% on average in October; this is followed by an even stronger showing in November and a 3% increase in December on average. According to the Bank of America, the industry has historically outperformed the S&P 500 in three of the last six months of the year—namely September, October and November.
Restructuring and Consolidation Continue to Reshape U.S. Aviation
You might have seen the news this week that Spirit Airlines has filed for bankruptcy for the second time in less than a year.
To some, this is proof that the ultra-low-cost carrier (ULCC) model, which Spirit helped pioneer, is on its way out.
But for those of us who’ve been following the airline industry for years, this is simply the latest chapter in a familiar story of resilience and consolidation.
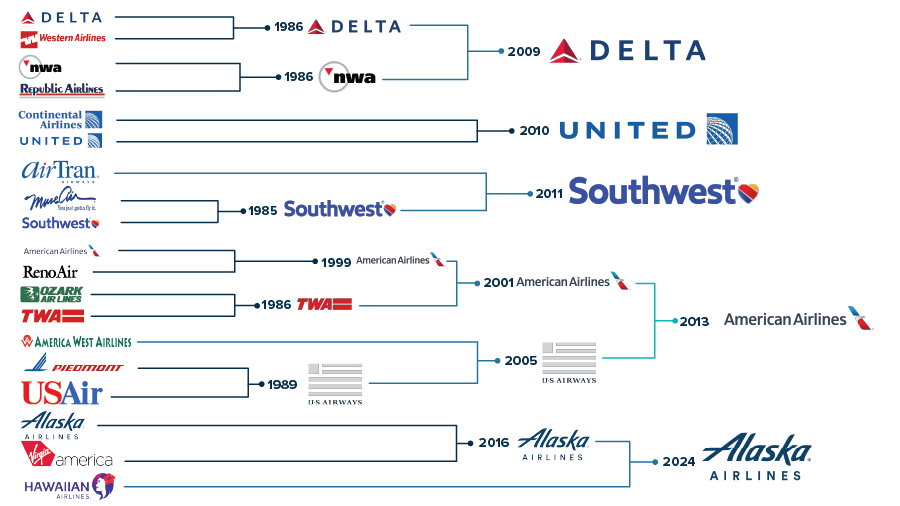
Between 2002 and 2007, several household airline names entered bankruptcy protection. Those included US Airways, which restructured twice in the span of three years; United Airlines, which spent four years reorganizing under court supervision; and Northwest Airlines and Delta Air Lines, which filed in 2005 and emerged two years later.
These restructurings were painful but necessary. Airlines shed excess debt, renegotiated labor contracts and modernized fleets.
They also introduced new revenue streams. Ancillary fees—those charges for checked bags, seat upgrades and snacks—went from being ridiculed to becoming a crucial profit center.
By the time the financial crisis hit, airlines were leaner and better equipped to withstand shocks. US Airways merged with America West in 2005, and Delta absorbed Northwest in 2008. These combinations have given rise to the competitive landscape we know today, dominated by four major carriers, hotly pursued by Alaska Airlines, which finalized its acquisition of Hawaiian Airlines last year and now controls a little over 6% of the domestic market.
Can the ULCC Model Survive?
We’re not trying to sugarcoat Spirit’s situation. The airline emerged from Chapter 11 just this past March after restructuring roughly $1.6 billion in debt, only to find itself back in court by August.
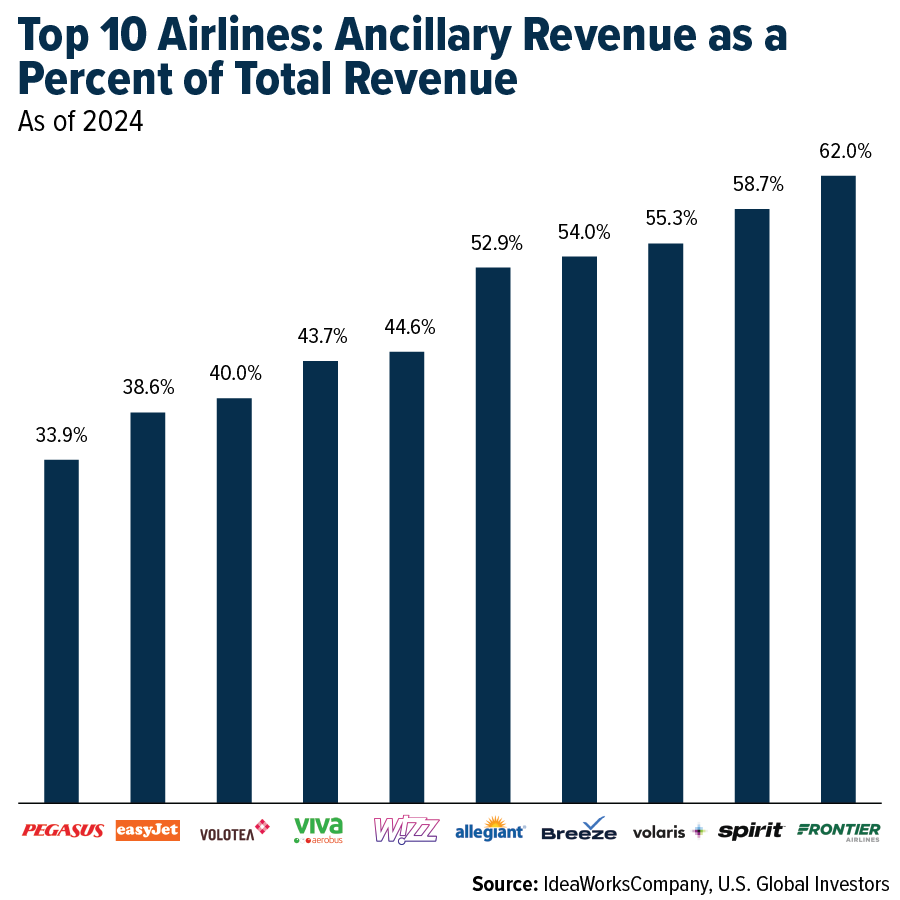
It’s worth remembering that Spirit was once the poster child for the ULCC model. Its no-frills approach—non-reclining seats, fees for carry-ons and à-la-carte pricing—allowed it to offer rock-bottom fares that attracted price-sensitive travelers. Ancillary revenue became its lifeblood, with nearly 59% of its total revenue in 2024 coming from add-ons, according to IdeaWorks data. That put Spirit near the very top of the global rankings.
Click here to see the top 10 holdings in JETS.
Air Travel Demand Reaches New Heights
It’s important not to lose sight of the fact that demand for air travel remains strong.
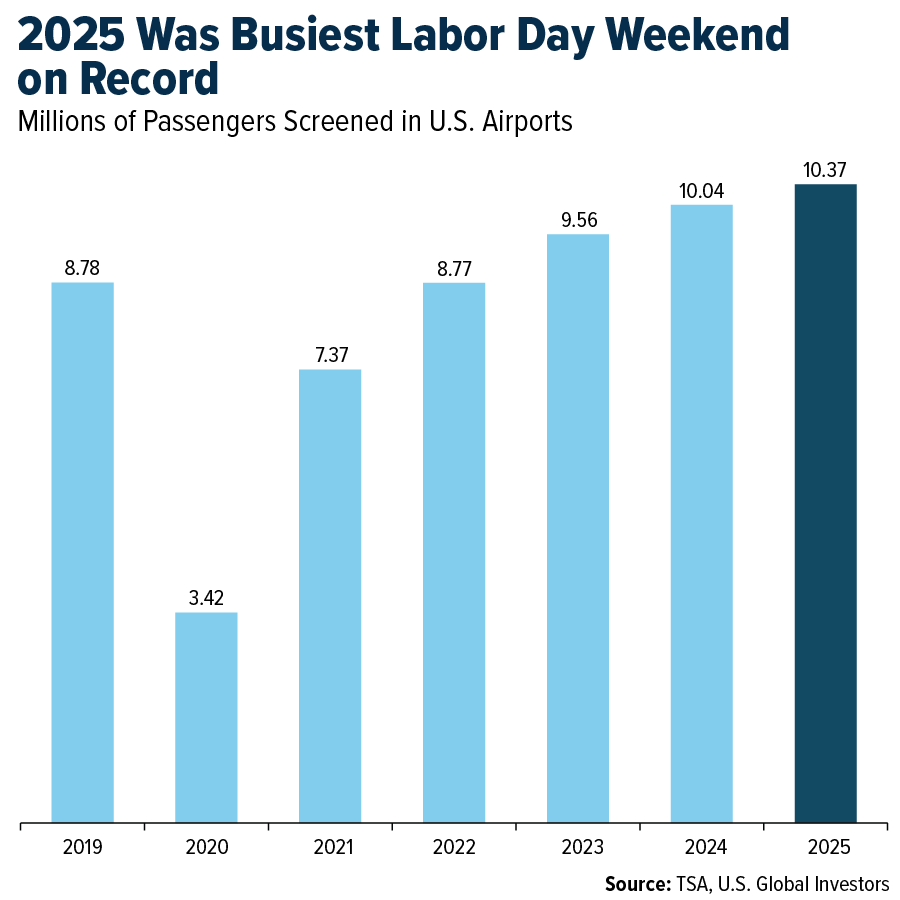
This summer, the Transportation Security Administration (TSA) screened record numbers of passengers. Over the Labor Day weekend alone, nearly 10.4 million travelers passed through airport security, a 3.3% jump from last year. Eight of the 10 busiest days in TSA’s two-decade history occurred just this summer.
Globally, passenger traffic grew 4% year-over-year in July, according to the International Air Transport Association (IATA). International routes were particularly strong, rising 5.3%. And here in the U.S., travel exports—foreign visitors spending on U.S. goods and services—hit an all-time high of $126.9 billion in the first six months of 2025.
Corporate Bankruptcies Surge to Post-Crisis Highs
Of course, we can’t ignore the macroeconomic backdrop. Spirit’s downfall is partly the result of higher interest rates. After years of cheap credit, the Federal Reserve hiked aggressively beginning in 2022, pushing borrowing costs above 5%. Corporate bankruptcies spiked, reaching their highest level since 2010.
Airlines, like other capital-intensive industries, rely heavily on debt financing. Elevated rates increase debt service costs, squeezing margins.
But remember: the majors are better positioned today than they were in the early 2000s. Balance sheets are stronger, cash reserves are larger and fleets are more efficient.
What’s more, the Fed cut its benchmark rate by a full percentage point late last year and has kept it steady in 2025. That policy shift, combined with cooling inflation, should ease some of the pressure on corporate borrowers going forward.
Introducing the JETS ETF
For investors seeking a way to participate directly in the ongoing evolution of global air travel, the U.S. Global Jets ETF (NYSE: JETS) provides a disciplined solution. The airlines ETF gives investors diversified exposure not just to domestic carriers, but also to international airlines, aircraft manufacturers, airport operators and related service providers.
What sets JETS apart is its Smart Beta 2.0 strategy, which combines the broad access of passive investing with the selectivity of active management. The underlying index uses a rules-based, quantamental approach to rank companies on fundamental factors such as passenger load factor, gross margin and sales yield. This allows JETS to tilt toward what we believe are the world’s most efficient and financially resilient carriers, while still maintaining diversified global exposure.
With air travel demand continuing to expand and airlines diversifying their revenue models, JETS offers investors a targeted way to capture both the cyclical recovery and long-term structural growth of aviation.
Request additional information on JETS by clicking here!
Please carefully consider a fund’s investment objectives, risks, charges, and expenses. For this and other important information, obtain a statutory and summary prospectus for JETS by clicking here. Read it carefully before investing.
Investing involves risk, including the possible loss of principal. Shares of any ETF are bought and sold at market price (not NAV), may trade at a discount or premium to NAV and are not individually redeemed from the funds. Brokerage commissions will reduce returns. Because the funds concentrate their investments in specific industries, the funds may be subject to greater risks and fluctuations than a portfolio representing a broader range of industries. The funds are non-diversified, meaning they may concentrate more of their assets in a smaller number of issuers than diversified funds. The funds invest in foreign securities which involve greater volatility and political, economic and currency risks and differences in accounting methods. These risks are greater for investments in emerging markets.
The funds may invest in the securities of smaller-capitalization companies, which may be more volatile than funds that invest in larger, more established companies. The performance of the funds may diverge from that of the index. Because the funds may employ a representative sampling strategy and may also invest in securities that are not included in the index, the funds may experience tracking error to a greater extent than funds that seek to replicate an index. The funds are not actively managed and may be affected by a general decline in market segments related to the index.
Airline Companies may be adversely affected by a downturn in economic conditions that can result in decreased demand for air travel and may also be significantly affected by changes in fuel prices, labor relations and insurance costs.
Fund holdings and allocations are subject to change at any time. Click to view fund holdings for JETS.
Smart Beta 2.0 refers to investment strategies that blend the benefits of passive indexing with elements of active management by using alternative weighting methods based on fundamental and quantitative factors.
Distributed by Quasar Distributors, LLC. U.S. Global Investors is the investment adviser to JETS.
All opinions expressed and data provided are subject to change without notice. Some of these opinions may not be appropriate to every investor.
Passenger Load Factor (PLF) is the percentage of available seats on a public transport vehicle, such as an airline, that are filled by paying passengers. Gross margin is a profitability metric expressed as a percentage, calculated by subtracting the cost of goods sold (COGS) (or cost of sales) from a company’s total revenue and then dividing the result by the total revenue. Sales yield refers to the revenue or value generated from a specific sale or overall sales effort.
The U.S. Global JETS Index seeks to provide access to the global airline industry. The index uses various fundamental screens to determine the most efficient airline companies in the world, and also provides diversification through exposure to global aircraft manufacturers and airport companies. The index consists of common stocks listed on well-developed exchanges across the globe. An investment cannot be made directly in an index.
The S&P 500 is a stock market index weighted by market capitalization that is made up of 500 of the largest public companies in the United States. The NYSE Arca Global Airline Index is a modified equal-dollar weighted index designed to measure the performance of highly capitalized and liquid international airline companies.