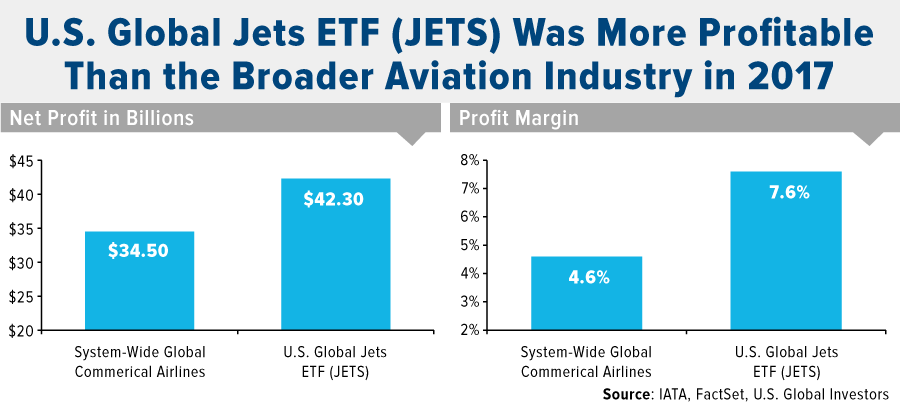
The companies held in our U.S. Global Jets ETF (JETS) were far more profitable than a broader basket of global commercial airlines in 2017, implying superior stock selection. The International Air Transport Association (IATA) estimates that system-wide commercial airlines across the globe netted $34.5 billion in profits with a 4.6 percent profit margin. JETS, by comparison, ended the year with more than $42 billion in profits and an impressive 7.6 percent profit margin, 300 basis points above the broader market, according to FactSet data.

So what accounts for JETS’ improvement in profitability? For one thing, all of the holdings in JETS were highly profitable last year in absolute terms except for one, Air France, which has only a 1 percent weighting.
But the main answer lies in the fund’s smart-beta model. Besides having dynamic, rules-based stock selection and weighting, the fund casts a wider net than the IATA. Instead of focusing just on carriers, it also invests in aircraft manufacturers and airport operators from all over the world.
Investing Across the Value Chain
Consider Boeing, the world’s number one plane maker by sales, with a 38 percent share in 2016. The company reported record earnings in 2017 of $8.2 billion, an increase of 67 percent over the previous year. Contributing to this was news that Boeing had produced and delivered a record number of aircraft during the year, as well as received 912 net new orders during the year, valued at an unbelievable $134.8 billion. The Chicago-based jet manufacturer, which represents a little over 3 percent of JETS, was the best performing stock in the Dow Jones Industrial Average in 2017, returning 89.43 percent.
Then there are airport operators such as Mexico’s Grupo Aeroportuario del Centro Norte, or OMA, which benefit from an expanding middle class in emerging markets. Airport operating companies are similar to utilities, in that they enjoy a stable business model with monopolistic controls on arrival and departure terminals in various cities. Carriers are charged service fees, which are mostly dependent on air traffic. Based on trends in air traffic growth, we believe these fees are likely to expand consistently over the next 25 years.

OMA’s passenger traffic in 2017 grew 4.8 percent year-over-year to 19.7 million people, a new record. Net income came in at 2.1 billion pesos, or $118 million, a 14 percent increase from the previous year. This resulted in earnings per share (EPS) of $2.19, up 19 percent from $1.84 in 2016.
Since OMA announced on April 5 that passenger traffic at its 13 airports increased 10.8 percent in March compared to the same month last year, shares have surged approximately the same amount, 10.8 percent, through April 16. OMA has a 1.12 percent weighting in JETS.
Thanks to Non-Ticket Fees, Delta Generated Record Revenue
Close to 50 percent of JETS is invested in the four largest carriers in the U.S., with Delta Air Lines taking the top weighting at over 12 percent as of April 16. The Atlanta-based carrier recently reported $9.8 billion in revenue in the March quarter, an 8 percent improvement over the same quarter last year and representing a record amount for the March quarter.
As for ancillary, or non-ticket, revenue, Delta reported making $521 million during the quarter, a phenomenal 67 percent increase over the same quarter in 2017. A large contributor to these fees have been Delta’s partnership with American Express. According to the Wall Street Journal, more than a million new accounts were opened last year for Delta and American Express’ joint credit card, which has given the carrier a significant sales boost through payments it receives for frequent flier miles.
Ancillary revenue has increasingly become more important in driving airline profitability and fixing finances around the globe. According to consulting firm IdeaWorks, global airlines generated an estimated $82.2 billion in non-ticket fees, up from $67.4 billion in 2016.
Now Could Be an Attractive Entry Point for Investors
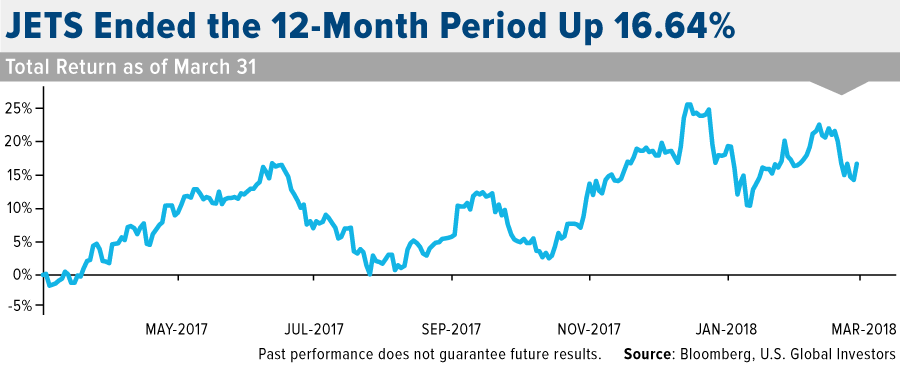
For the 12-month period as of March 31, the U.S. Global Jets ETF (JETS) returned 16.64 percent, beating the S&P 500 Index, which gained just under 14 percent for the same period.

With airline profits potentially on the rise, along with higher ancillary revenue and a recovering global economy, now might be an ideal time for investors to consider gaining exposure to the broader aviation space. JETS is the only airline-focused exchange-traded fund available today, making it a convenient “one-click” way to invest in the global airline market, which includes not just commercial carriers but also airline operators and manufacturers.
Past performance does not guarantee future results.

The performance data quoted represents past performance. Past performance does not guarantee future results. The investment return and principal value of an investment will fluctuate so that an investor’s shares, when sold or redeemed, may be worth more or less than their original cost and current performance may be lower or higher than the performance quoted. Short term performance, in particular, is not a good indication of the fund’s future performance, and an investment should not be made based solely on returns. For performance data current to the most recent month-end please visit www.usglobaletfs.com.
The Dow Jones Industrial Average (DJIA) is a price-weighted average of 30 significant stocks traded on the New York Stock Exchange (NYSE) and the NASDAQ. The S&P 500 Index is a basket of 500 of the largest U.S. stocks, weighted by market capitalization.
A basis point is one hundredth of one percent, used chiefly in expressing differences of interest rates.
Earnings per share (EPS) is the portion of a company’s profit allocated to each outstanding share of common stock. Earnings per share serves as an indicator of a company’s profitability.
Beta is a measure of a stock’s volatility relative to the overall market. It is most often calculated using a stock’s movements relative to the S&P 500 Index over the trailing 12-month period.
All opinions expressed and data provided are subject to change without notice. Some of these opinions may not be appropriate to every investor.
