Alan Joyce, CEO of Australia’s flagship carrier Qantas Airways, has never seen anything like it. The economic impact of the COVID-19 pandemic has been “the single biggest shock that global aviation has ever experienced,” he said in a recent memo to the airline’s 30,000 staff members.
Joyce’s message rings loud and clear. Due to global travel restrictions in the days since the World Health Organization (WHO) declared the outbreak a pandemic, airlines have been seeing more cancellations than bookings, forcing them to slash capacity and send staff home. The decline in demand as a result of the spread of COVID-19 could end up being double the decline from the severe acute respiratory syndrome (SARS) epidemic in 2002 and 2003, according to travel research firm Tourism Economics. This implies 16 million lost passengers, which is more than the multi-year impact following the 9/11 terrorist attacks.
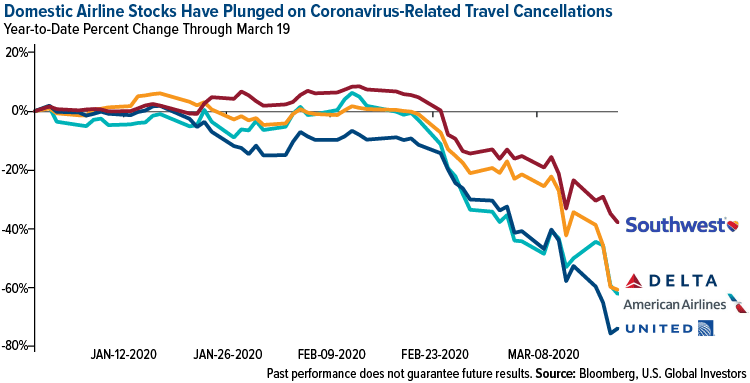
Like most of the rest of the market, domestic airline stocks have sold off, with United dropping the most at negative 74 percent year-to-date through March 19. Southwest was down the least, falling 38 percent over the same period, due to its having far less international exposure as well as a stronger balance sheet than its larger peers.
The virus, according to United CEO Oscar Munoz, has created “an unprecedented challenge.”
Be that as it may, I see it as having created an attractive buying opportunity. Air travel isn’t going away. At some point, the threat of the coronavirus will subside, and people will once again need to quickly get from point A to point B, either for business or leisure. Perhaps we’ll fly in rockets in the future, or rely on Star Trek-style beam technology, but for now, the only thing that can provide that sort of speed and dependability is a passenger jet.
I’m not in any way negating the severity of COVID-19 or the economic mayhem it’s caused. But in all fairness, this is not the first major headwind that global airlines have been up against. The truth is that air travel has proved to be remarkably resilient to many external shocks, whether they be oil crises, wars, terrorist attacks or, yes, pandemics.
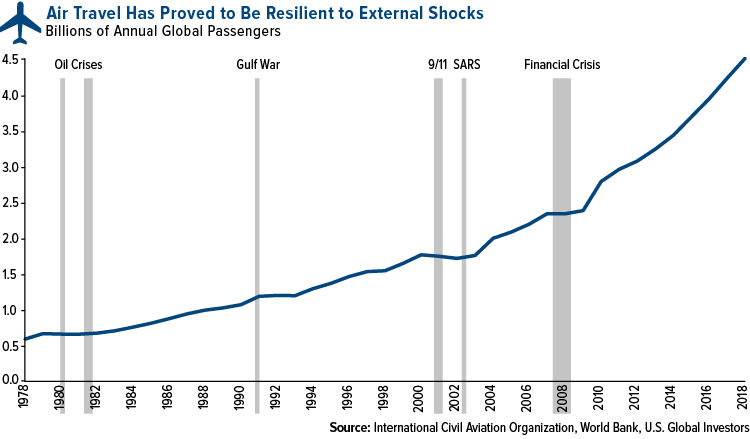
Such events may have temporarily halted the increase in the number of passengers that take to the skies every year, but once the crisis was behind us, growth tended to resume. In 2018, the most recent year of data, the number of people who traveled at least once by plane hit an incredible 4.3 billion. I expect this number to continue to grow, perhaps not this year—Tourism Economics says the annual decline could be as much as 17.9 percent—but in the years to come. That’s especially the case as the size of the global middle class continues to expand.
Getting Technical
On a shorter-horizon basis, now is beginning to look like an attractive time to consider buying into the industry. Below is the 14-day relative strength index (RSI) for the NYSE Arca Global Airlines Index, going all the way back to 2001. It shows that airline stocks were recently at their most oversold since September 2001. The RSI hit 13.9 on March 3, the lowest it’s been since September 21, 2001, just days after 9/11, when the index was at 7.7.
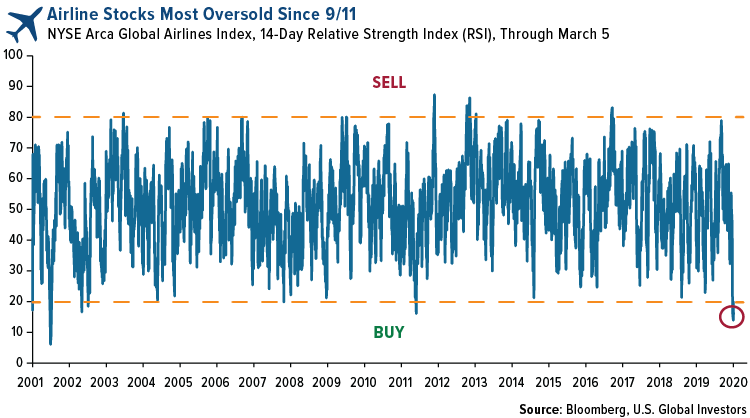
Obviously there are multiple factors investors should consider, including time period and asset class, but historically speaking, when the RSI fell below 20, it was an opportune time to consider adding to your position.
Here’s another way to look at it.
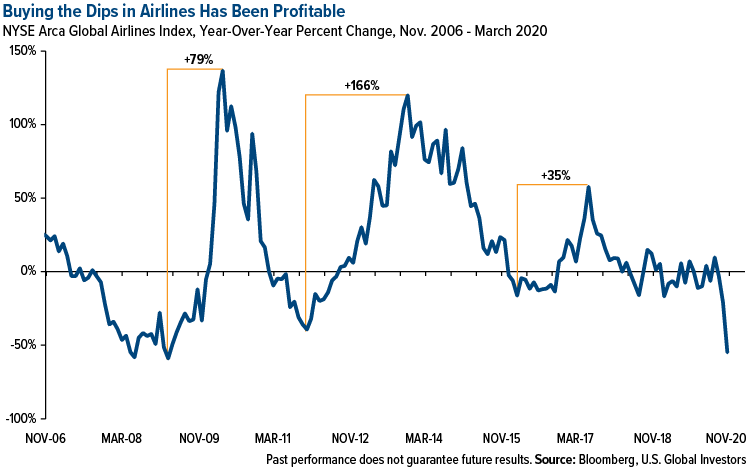
Buying the dips has generally been a profitable decision for airline investors. What you see below is global airline stocks’ year-over-year percent change. When stocks turned negative compared to the same time a year earlier, it created an attractive buying opportunity that could have resulted in healthy returns. For instance, if you bought airline stocks in March 2009, near the bottom of the financial crisis, and held until March 2010, you would have seen a profit of nearly 80 percent. Returns would have been ever better at 166 percent if you entered in September 2011 and exited in November 2013.
Index performance is not indicative of fund performance. To obtain fund performance click here.
As of March 19, the global airlines index was off more than 56 percent compared to 12 months ago. I believe that’s an incredible discount.
Our own U.S. Global Jets ETF (JETS) has seen a huge jump in daily trading volume since the selloff began. So far in March through the 18th, daily volume has averaged 1.6 million, a whopping increase of 5,145 percent from the same period a year earlier.
Help Appears to Be on the Way
On a final note, Congress and the Trump administration have acknowledged that the travel industry, and particularly domestic airlines, are most impacted by COVID-19 and, therefore, in need of government assistance.
His concern is understandable. It’s an election year, after all, and the president is highly motivated to do what he can to prop up the economy as a whole. Since Eisenhower, no president has won reelection when the economy was in recession.
But more than that, aviation is a huge part of the engine that drives American (and global) commerce. It’s integral to business expansion. And as employers, carriers are massive. As of January 2020, the industry, from major airlines all the way down to small regional carriers, directly employed as many as 747,370 people, according to data from the Bureau of Transportation Statistics (BTS).
For these reasons, I don’t believe Congress and the president can so easily ignore airlines’ financial woes, which is why a plan is currently in the works to lend the group $50 billion in its coronavirus stimulus package. More may be required in the future, but it’s a start.
In the meantime, I invite you to learn more about the U.S. Global Jets ETF (JETS), the only ETF on the market today that focuses on the aviation industry. JETS provides access to the global airline industry, including airline operators and manufacturers from all over the world.
The NYSE Arca Global Airline Index (“AXGAL” or “Index”) is a modified equal- dollar weighted index designed to measure the performance of highly capitalized and liquid international airline companies. The Index tracks the price performance of selected local market stocks or ADRs of major U.S. and overseas airlines.
The relative strength index (RSI) is a momentum indicator that measures the magnitude of recent price changes to evaluate overbought or oversold conditions in the price of a stock or other asset. The RSI is displayed as an oscillator (a line graph that moves between two extremes) and can have a reading from 0 to 100.
