
We believe government policy is a precursor to change, and as a result we carefully monitor and track both fiscal and monetary policies that could have an impact on the gold market. As the Federal Reserve continues to hike interest rates, the bears’ case for gold seems to be gaining strength. However, this assessment could be premature, causing investors to potentially lose out on a lucrative position in the yellow metal.
Two Big Drivers of Gold Demand
The first driver is what we call the Love Trade – the practice of purchasing gold as gifts for loved ones during holidays and festivals. Such gift giving is especially prominent in China and India, the world’s two largest consumers of gold, according to the World Gold Council (WGC). The other driver is the Fear Trade – the purchasing of gold out of fear of war or concern over government policies. This group primarily sees gold as a store of value during economic turbulence or geopolitical turmoil.

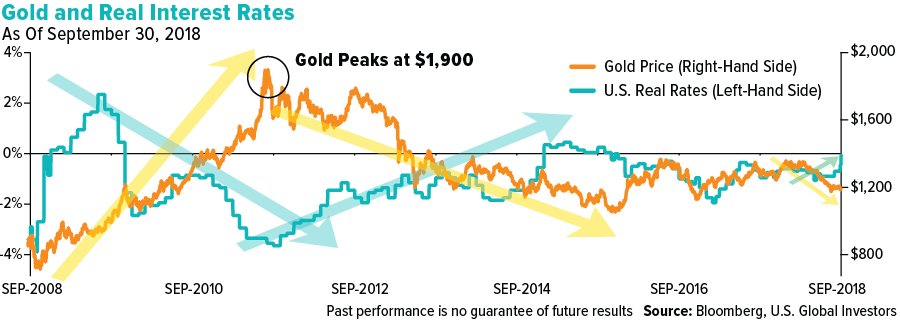
One of the strongest contributors to the Fear Trade? Real interest rates. Whenever a country has negative-to-low real rates of return, which means the inflationary rate – or Consumer Price Index (CPI) – is greater than the current interest rate, gold tends to rise in that country’s currency.
Our research tells us that the tipping point for gold is when real interest rates go above the 2 percent mark. Historically, both gold and silver have performed well in a low or negative real interest rate environment.
Consider the ice cube, which shows how new equilibriums can have significant effects. At 31 degrees, H2O is a solid chunk, but when the temperature increases, the mass slowly begins to turn into a liquid. Above 32 degrees, ice changes form from solid to liquid, but it’s still made of hydrogen and oxygen.
Money is like water in this sense. When many other economic dynamics such as population growth, urbanization rates and changes in government policies reach their tipping point, the velocity of money tends to be altered.
How Close to Gold’s Tipping Point Are We?
In other words, what is the real interest rate today? As of October 2018, the 5-year Treasury bill yields 2.95 percent and inflation sits at 2.30 percent, making the real interest rate a low 0.65 percent.
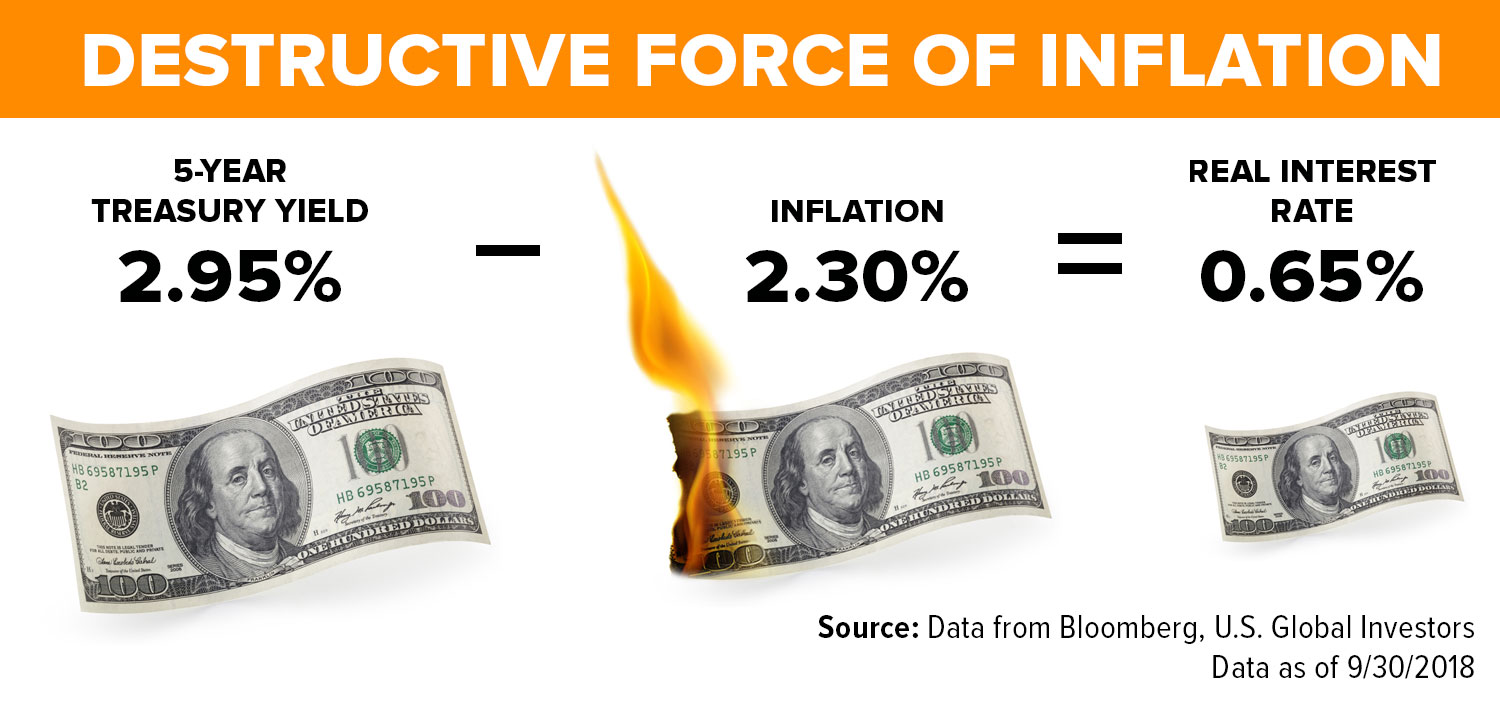
If real interest rates rose steadily above the psychologically important 2 percent threshold, we believe it could have a negative effect on the price of gold. That’s because in a high interest rate environment, gold and silver lose their luster as stores of value.
In order for that tipping point to happen, rates would need to continue rising above inflation, and inflation would need to remain low. These are the forecasts made by some gold bears today; however, you might not want to get too trigger happy just yet, as recent data challenges these assumptions.
Using Unemployment to Gauge the Health of the Economy
Take the monthly unemployment figure, which is one of the primary indicators the Federal Reserve studies when evaluating the economy. Depending on the definition of an unemployed person, however, the numbers reveal different results.
The official U3 unemployment rate, the exact figure the Fed uses, tracks the total unemployed as a percent of the civilian labor force. The broadest gauge calculated by the Bureau of Labor Statistics (BLS) is the U6 unemployment rate. For this number, the BLS adds in all those people who are marginally attached to the labor force, plus people working part-time but want to work full-time.
What does “marginally attached to the labor force” mean? These people are neither working nor looking for work but indicate they want a job, are available to work and have worked during some period in the last 12 months. These marginally attached people also include discouraged workers who are not looking for work because of some job-market related reason.
Williams’ ShadowStats unemployment rate paints a different picture.
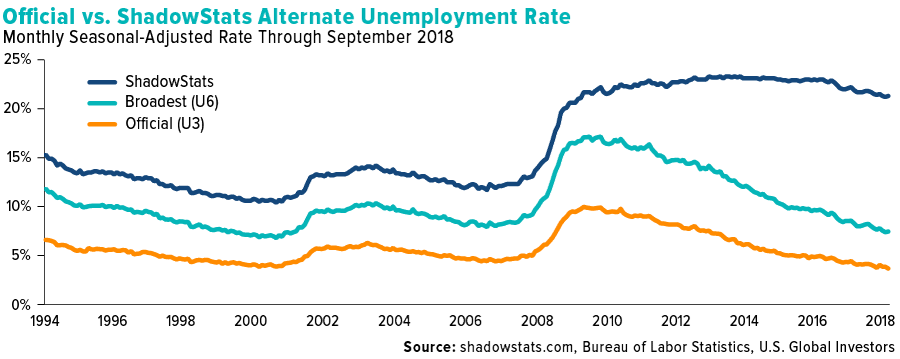
Then there’s a measure of the labor market the BLS tracked prior to 1994. This is the seasonally-adjusted alternate unemployment rate that statistician John Williams continued to calculate. It’s basically the U6 plus long-term discouraged workers.
The figures closely followed one another from 1994 through 2009. Then, in 2010, Williams’ ShadowStats unemployment rate decoupled from the U3 and U6. Although the BLS’ rates have trended significantly downward since then, ShadowStats’ data states that the unemployment rate is actually 21.30 percent as of September 2018.
Could the official unemployment figure be overstating the health of the economy? If unemployment is actually above 20 percent, as opposed to the official 3.7 percent, then the U.S. economy hasn’t yet recovered from the financial crisis in 2008.
A Rising Interest Rate Environment
Beyond the jobs market, the economy has contended with the Federal Reserve increasing interest rates repeatedly. The Fed has raised rates eight times since 2015, three of which came in 2018.
Despite President Donald Trump’s concerns that the Fed has “gone crazy,” there is a clear method to their supposed madness, with about one hike per quarter. During the Jackson Hole Economic Symposium, Federal Reserve Chairman Jerome Powell emphasized to investors that the central bank is committed to raising interest rates gradually.

Friction between the president and the Fed has built up alongside interest rates. “I’m very unhappy with the Fed because Obama had zero interest rates,” said Trump in an interview with The Wall Street Journal.
While the Fed is indeed tightening, it is a stretch to call monetary policy “too tight.” After the hike in September, the federal funds rate now stands at 2.25 percent. That’s up considerably from its near-zero rate during much of Barack Obama’s two terms as president, but it’s still historically low, not yet having reached the long-term average of 4.82 percent.

One of Trump’s primary goals during his presidency has been building a strong economy. Higher rates are a reflection of success in that regard. The Fed lowered interest rates dramatically to aid in recovery from the 2008 financial crisis. Only recently has the economy’s rehabilitation reached a point where it is comfortable normalizing rates.
Investors do have cause, however, to pay close attention to the Fed’s activity. “My opinion is that business cycles don’t just end accidentally. They end by the Fed,” said MKM Partners’ chief economist Mike Darda. “If the Fed tightens enough to induce a recession, that’s the end of the business cycle.”
Historically speaking, rate hike cycles have mixed results. Only three such cycles in the last 100 years have not ended in a recession according to Incrementum research. There is no guarantee that this current round of tightening will have the same outcome, but the risk should be recognized, especially since another rate hike may occur in December of 2018.
At this year’s economic summit at Jackson Hole, Fed Chairman Jerome Powell gave investors insight into how he views the Fed’s actions, comparing creating policy to navigating by the stars. In his view, the Fed is keeping its eyes on a bright future while setting the course with “less-than-perfect” equipment. Powell’s strategy is to focus on risk management as he attempts to steer the economy, moving slowly and remaining prepared to act.
Exposing Gold Suppression
Powell may be candid about using imperfect tools to pursue his ideal outcome, but others are far more direct. It appears that gold suppression, or deliberate efforts to control the gold price, has long since stopped being a conspiracy theory and become simple reality. The yellow metal has historically tracked U.S. debt, yet in recent years, this has no longer been the case, with the two decoupling around 2013.
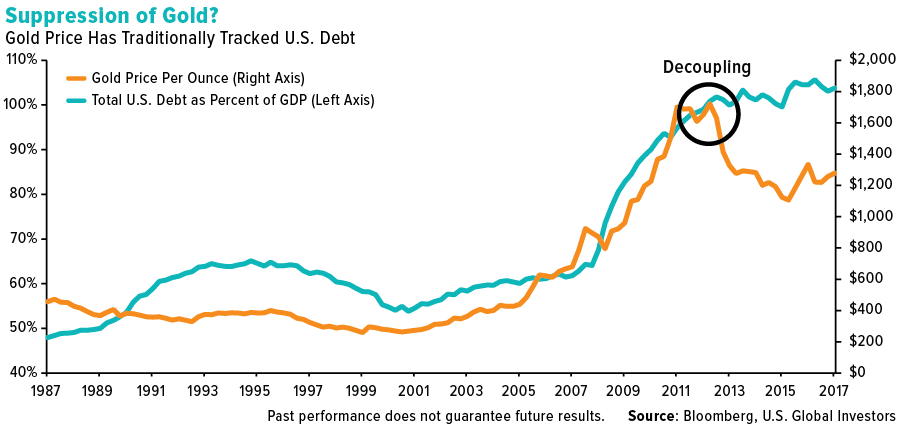
The question is not if gold is being actively suppressed, but to what extent and by whom. Here is one instance to consider. Traders at some large banks – including UBS, Deutsche Bank and HSBC – have been charged for manipulating the price of precious metals futures contracts and fined as much as $30 million by the Commodity Futures Trading Commission (CFTC).
Does this ruling mean gold suppression has concluded? It’s unlikely.
Here’s another example of suppression. In China, there is a semi-annual, seven-day-long national holiday called Golden Week in October, during which the markets are closed. In the past few years, gold has traded down the week prior. As much as $2.25 billion of the yellow metal was dumped in the futures market in October 2016, as someone sought to take advantage of the fact that markets were closed for the week in one of the world’s largest gold markets.
Gold Can Potentially Improve a Portfolio’s Risk-Adjusted Returns
Even in the face of these challenges, we believe gold can still shine. A certain amount of gold has the potential to improve a portfolio’s Sharpe ratio, according to the World Gold Council’s (WGC) October 2018 issue of Gold Investor. The Sharpe ratio measures a portfolio’s risk-adjusted returns relative to its peers, based on standard deviation. The higher the ratio is over its peers, the better the risk-adjusted returns.
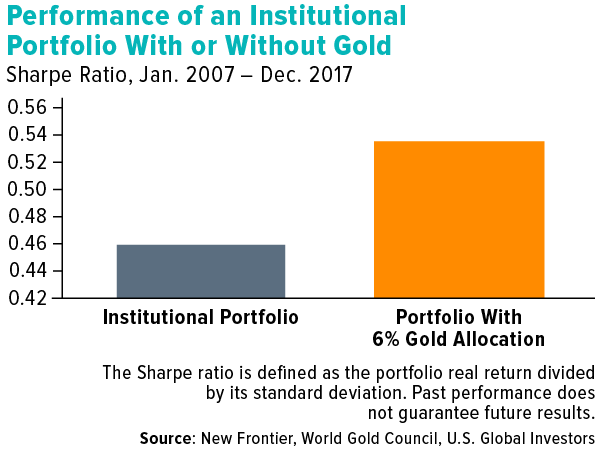
Asset management firm New Frontier Advisors studied major asset classes owned by Chinese institutional investors and found that a 6 percent weighting in gold was an optimal allocation. As you can see in the chart, a portfolio with 6 percent in gold had a higher Sharpe ratio than a portfolio without a gold position.
In light of both this illuminating research and our own hands-on experience, we advocate following the Golden Rule. The rule suggests a 10 percent portfolio allocation to gold, with 5 percent in bullion or gold jewelry and 5 percent in well-managed gold mutual funds or ETFs. Remember to rebalance annually, adjusting allocations and weightings as investment goals change.
Invest in the Gold Space with U.S. Global Investors
We believe an attractive way to invest in the gold space is with our U.S. Global GO GOLD and Precious Metal Miners ETF (GOAU), which provides investors access to companies engaged in the production of precious metals either through active or passive means. The fund does not invest directly in gold bullion. GOAU seeks high-quality, well-managed producers that have a proven track record of sustainable profitability – even when precious metal prices are down.
All opinions expressed and data provided are subject to change without notice. Some of these opinions may not be appropriate to every investor.
The Consumer Price Index (CPI) is one of the most widely recognized price measures for tracking the price of a market basket of goods and services purchased by individuals. The weights of components are based on consumer spending patterns.
Standard deviation is a measure of the dispersion of a set of data from its mean. The more spread apart the data, the higher the deviation. Standard deviation is also known as historical volatility.
The U-3 unemployment rate is the officially recognized rate of unemployment, measuring the number of unemployed people as a percentage of the labor force.
The U-6 unemployment rate provides a broad picture of the underutilization of labor in the country.
