
Summer is nearly upon us, and that means increased domestic and international air travel as American families go on vacation. The U.S. economy is humming, with unemployment below 4 percent and median household income on the rise, and so we anticipate yet another season of robust, profitable air passenger demand.
Speaking of profits, domestic passenger airlines pocketed $15.5 billion last year, according to the latest report by the Bureau of Transportation Statistics (BTS). The amount represents an improvement of more than 10 percent from 2016, but it still trails the all-time high of $24.8 billion in profits set in 2015.
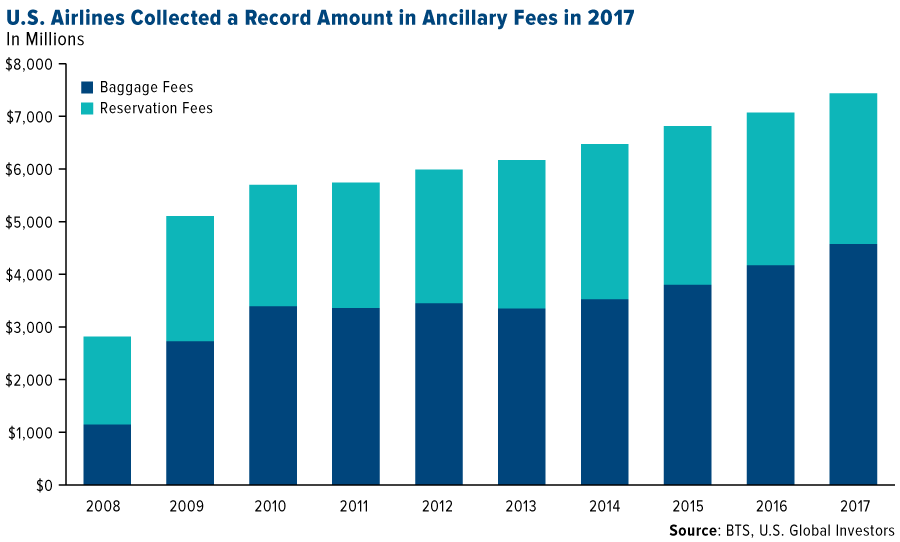
Revenue growth was driven primarily by ancillary, or non-ticket, fees. Carriers generated $2.9 billion in reservation change fees and a record $4.6 billion in baggage fees. Keep in mind that the combined $7.4 billion doesn’t include seating assignment upcharges; onboard sales of food, beverages, pillows and entertainment; or other additional fees airlines are not required to report to the BTS.
As you can see below, 2017 marked at least the ninth straight year of higher revenues for U.S. airlines.
Delta’s Deal with American Express Helped Deliver a Record First Quarter
Among the most lucrative, high-margin revenue streams is Delta Air Lines’ ongoing deal with American Express. Last year, more than 1 million new accounts were opened for the Delta SkyMiles credit card, a new record. This alone generated an estimated $3 billion in 2017. The Atlanta-based carrier believes that by 2021, the deal could contribute as much as $4 billion.
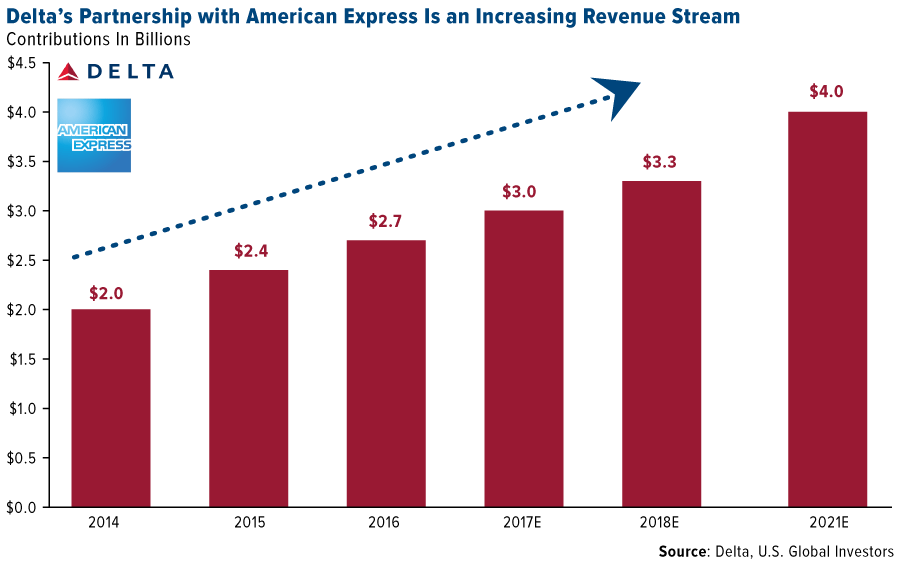
Delta, the second-largest holding in the U.S. Global Jets ETF (JETS), reported adjusted operating revenue of $9.8 billion for the March quarter, up 8 percent from the same period last year. This represents a record first-quarter for the company. A large contributor was higher ancillary fees, specifically the American Express partnership, which has given the carrier a significant sales boost through payments it receives for frequent flier miles.
It’s not just U.S. airlines that have embraced ancillary fees to help fix their finances. IdeaWorks, a global consultancy firm, estimates that world carriers’ non-ticket revenue exceeded $80 billion for the first time last year. The group believes the final total to be $82.2 billion, up 22 percent from 2016 and up an incredible 264 percent from 2010.
Global Load Factor Rose to All-Time High for Month of March
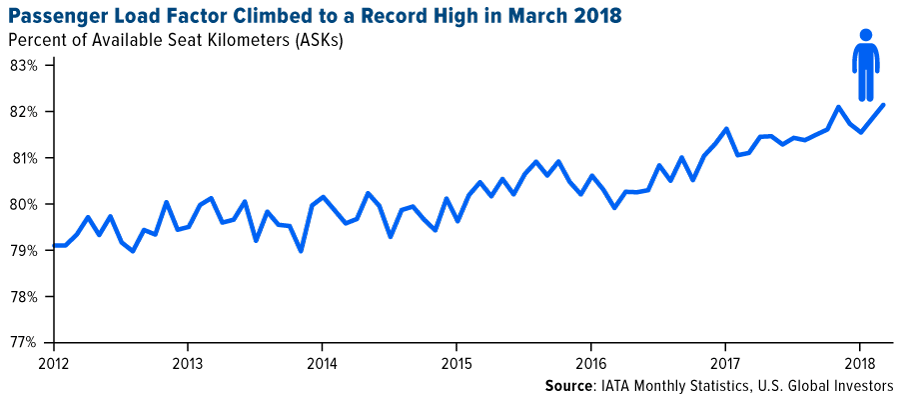
In other news, global air passenger demand, as measured in revenue passenger kilometers (RPKs), rose 9.5 percent year-over-year in March, the fastest pace in 12 months, according to the International Air Transport Association (IATA). The load factor climbed 2.3 percentage points to 82.4 percent, an all-time high for March. Except for the Middle East, all regions posted record load factors for the month.
In addition, global air cargo volumes were up 4.8 percent year-over-year in the first quarter of 2018, according to Air Cargo News. This figure was in line with analysts’ expectations of 4 to 5 percent growth.
Airlines Defied Higher Fuel Costs—Can They Do It Again?
Meanwhile, fuel costs continued to rise alongside oil during the quarter, according to U.S. Energy Information Administration (EIA) data. Kerosene-type jet fuel prices averaged $1.88 per gallon, up close to 8 percent from $1.74 in the December 2017 quarter, and up 25 percent from $1.50 in the first three months of 2017.
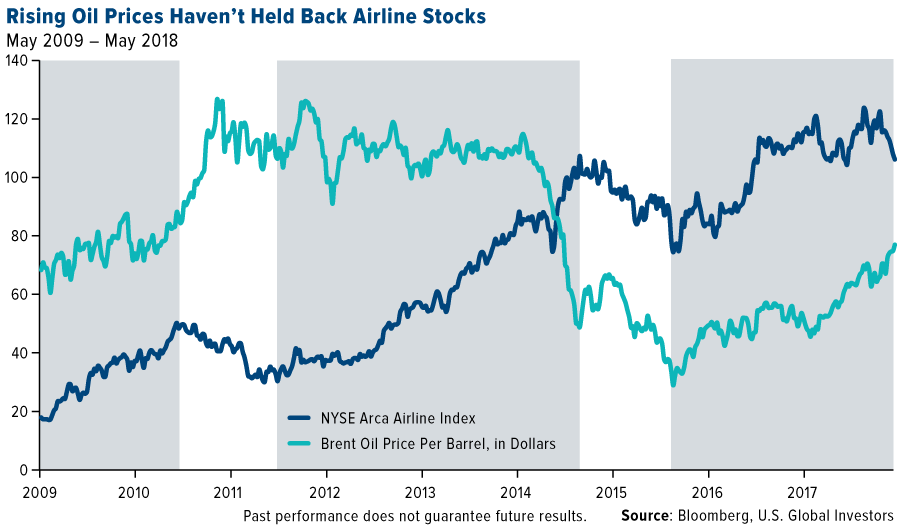
Historically, though, higher fuel costs haven’t necessarily been such a headwind for airlines. In the chart above, notice how airline stocks, as measured by the NYSE Arca Airline Index, appreciated even as the price of oil was rising or trading in the $100 to $120 range.
This is because higher fuel costs tend to force carriers to practice judicious capacity discipline to maintain a healthy supply-demand balance. Efforts might include adding more seats to existing jets and cutting unprofitable routes.
By contrast, when fuel costs dropped in the past—as they did in the second half of 2014—many airlines increased capacity a bit too overzealously, which in some cases led to a supply-demand imbalance.
The U.S. Global Jets ETF (JETS) is the only airline-focused exchange-traded fund available today, making it a convenient “one-click” way to invest in the global airline market, which includes not just commercial carriers but also airline operators and manufacturers.
The fund tracks the U.S. Global Jets Index (JETSX), which is rebalanced and reconstituted quarterly using a quantamental, smart-beta approach.
Operating revenue is revenue (sales) generated from a company’s day-to-day business activities, which means revenue posted from selling the company’s products and services.
Revenue passenger miles (RPMs) and revenue passenger kilometers (RPKs) are measures of traffic for an airline flight, bus or train calculated by multiplying the number of revenue-paying passengers aboard the vehicle by the distance traveled. Passenger load factor measures the capacity utilization of public transport services like airlines, passenger railways, and intercity bus services. It is generally used to assess how efficiently a transport provider fills seats and generates fare revenue.
The NYSE Arca Airline Index is a modified equal- dollar weighted index designed to measure the performance of highly capitalized and liquid international airline companies. The Index tracks the price performance of selected local market stocks or American depository receipts (ADRs) of major U.S. and overseas airlines.
Beta is a measure of the volatility, or systematic risk, of a security or a portfolio in comparison to the market as a whole. Beta is used in the capital asset pricing model (CAPM), which calculates the expected return of an asset based on its beta and expected market returns.
